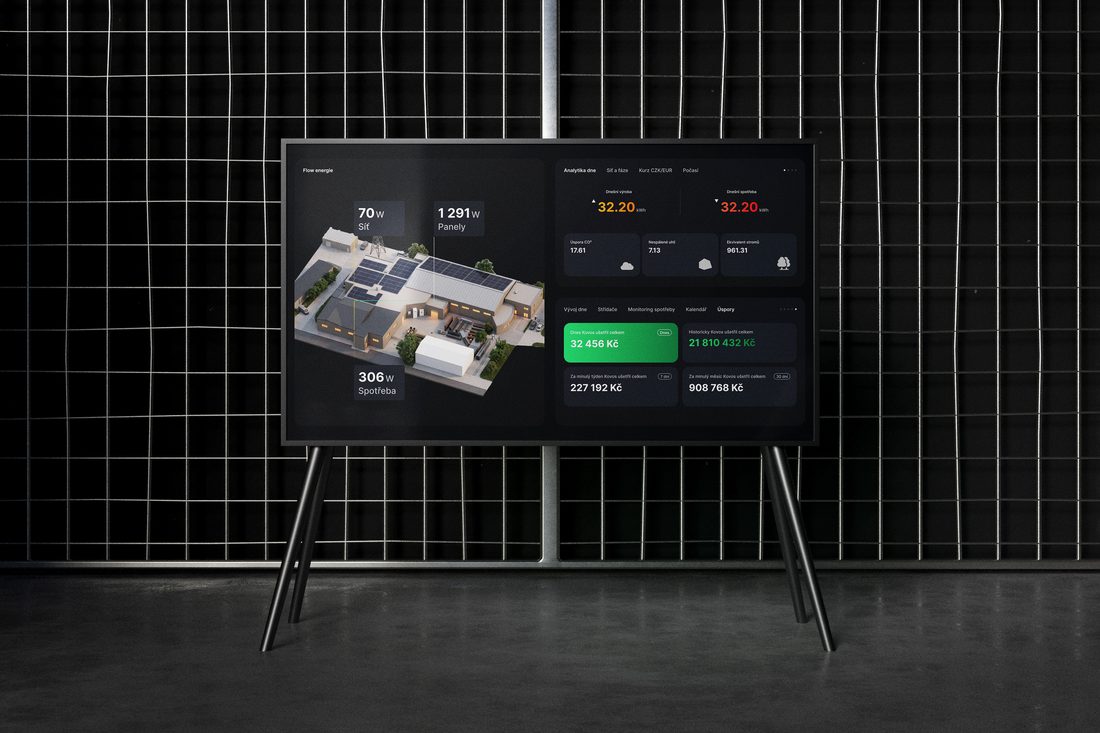
In 2026, Chytrá solární delivered a complete information-system solution for us, with its output shown on a large-screen TV in the entrance hall of our company. The project covered both the hardware installation of devices that measure and collect data from the photovoltaic power plant, which the company also installed for us, and the development and programming of software that processes this data and presents it clearly.
Thanks to a professional and, above all, individual approach, the system was also extended with further practical and useful widgets that go beyond monitoring the photovoltaic plant itself and match our specific needs.
The final solution exceeded our expectations, both in functionality and in visual design. We greatly appreciate the willingness, flexibility and ability to adapt the whole system to our requirements.
We are extremely satisfied with the work delivered and can wholeheartedly recommend Chytrá solární with a clear conscience.
We look forward to further cooperation, especially the planned expansion of the system with new features and ways to use it.
Chytrá
solární
monitoring
app
A solar monitoring app for homes and businesses – built module by module, so it can keep growing.
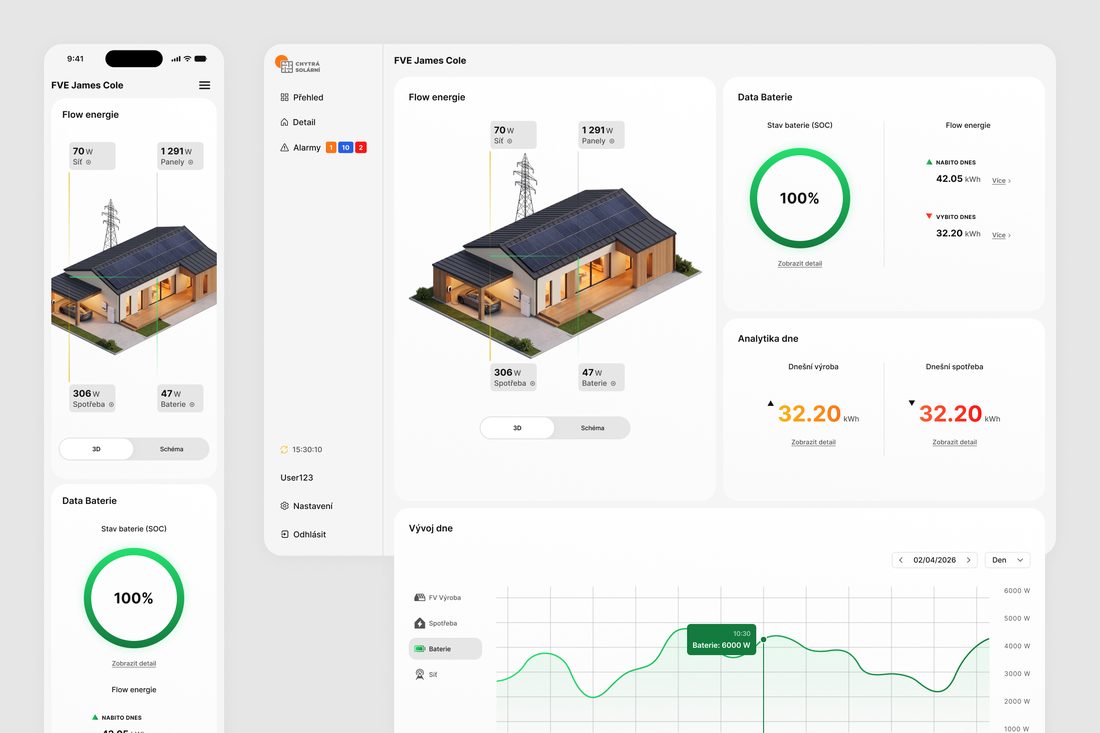
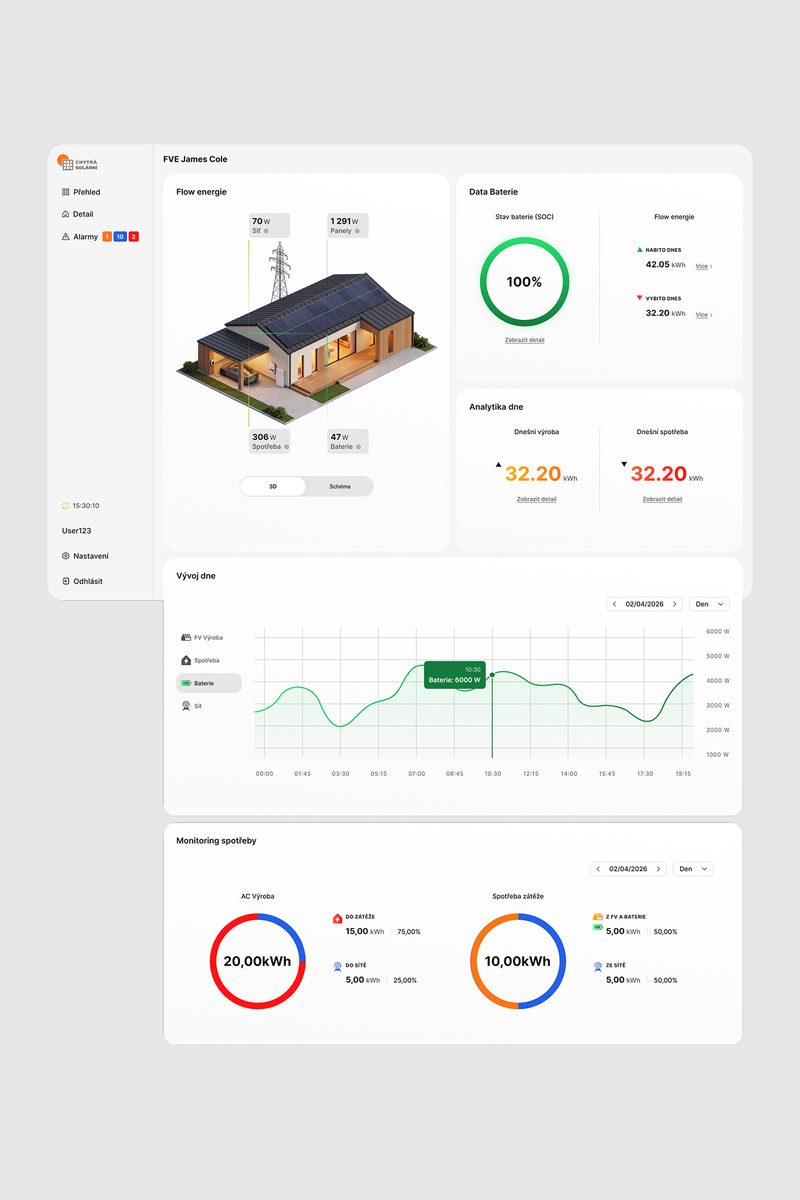
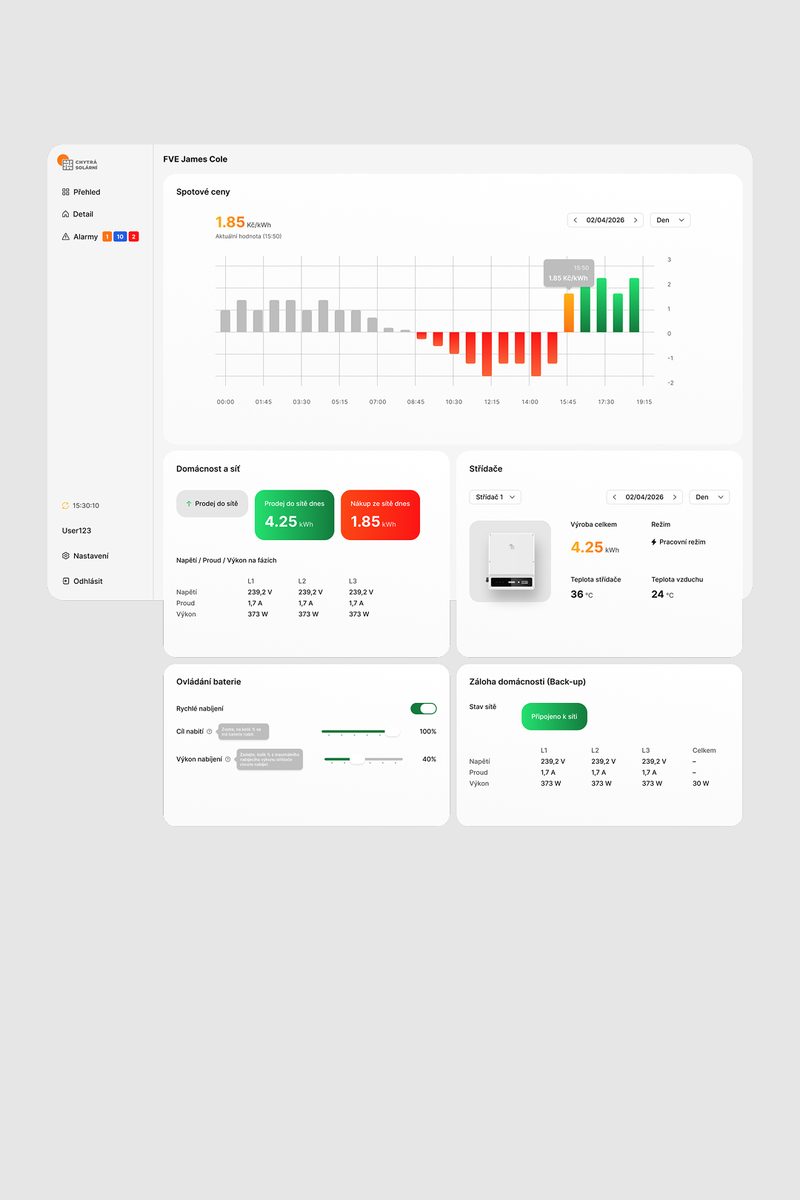
Chytrá solární is the monitoring app from Česká solární, for households and companies with solar panels on their roofs. It shows where energy is flowing, how full the battery is, and what was produced and used each day.
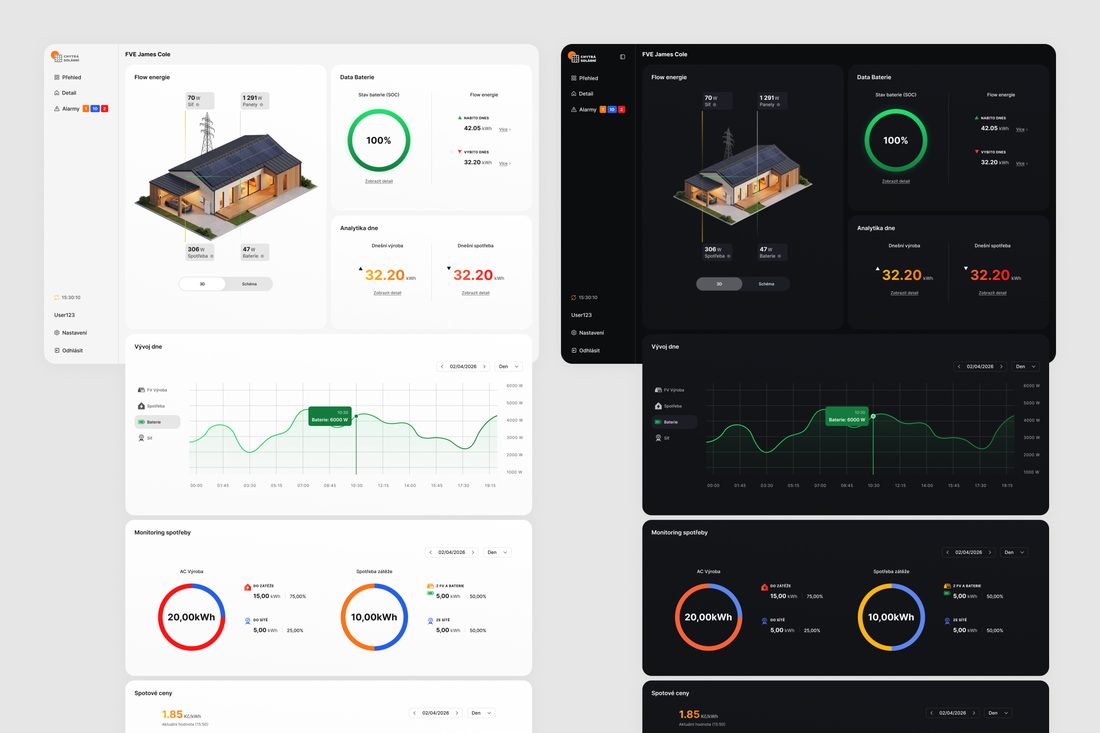
I designed it with Petr Havlíček (CTO) and a team of developers around one goal: energy data that feels clear and calm – on mobile or desktop, in light or dark mode.
Lots of data, little clarity
Solar monitoring tools tend to show everything at once: numbers, charts and statuses, all given the same weight. People open the app to answer one simple question – am I producing, using or storing energy right now? – and too often they leave without a clear answer.
Modules first, screens second
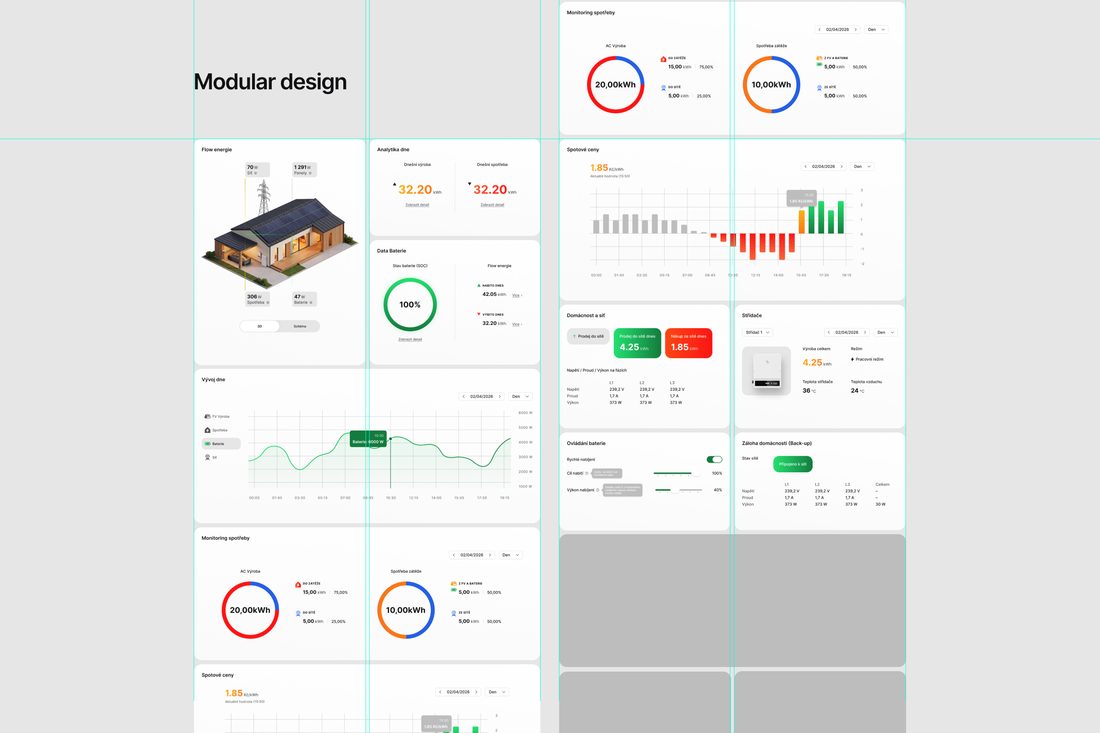
Instead of fixed screens, I designed a system of modules. Each part of the dashboard – energy flow, battery, production, consumption – is a self-contained block. It adapts to any screen and can be edited or swapped without touching the rest. Changes stay easy later on, and Petr can handle the smaller ones himself.
- 01Discovery & concept – a UX/UI audit, proposed changes, and a first visualisation of the house on mobile and desktop.
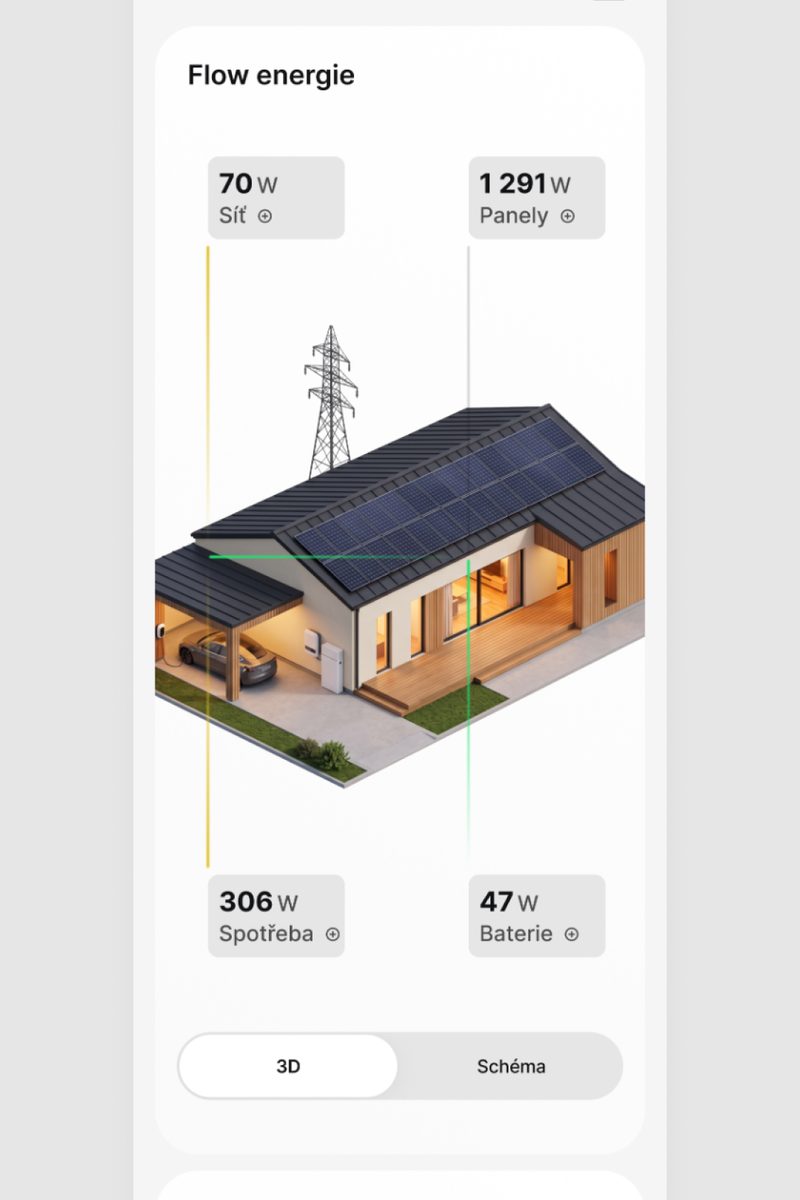
- 02House & energy flow – a 3D visualisation of the house, refined over many iterations, with a layer of hotspots and animated energy flow on top. On desktop it simply scales.
- 03Dashboard – hierarchy, layout and charts, so every number has its place.
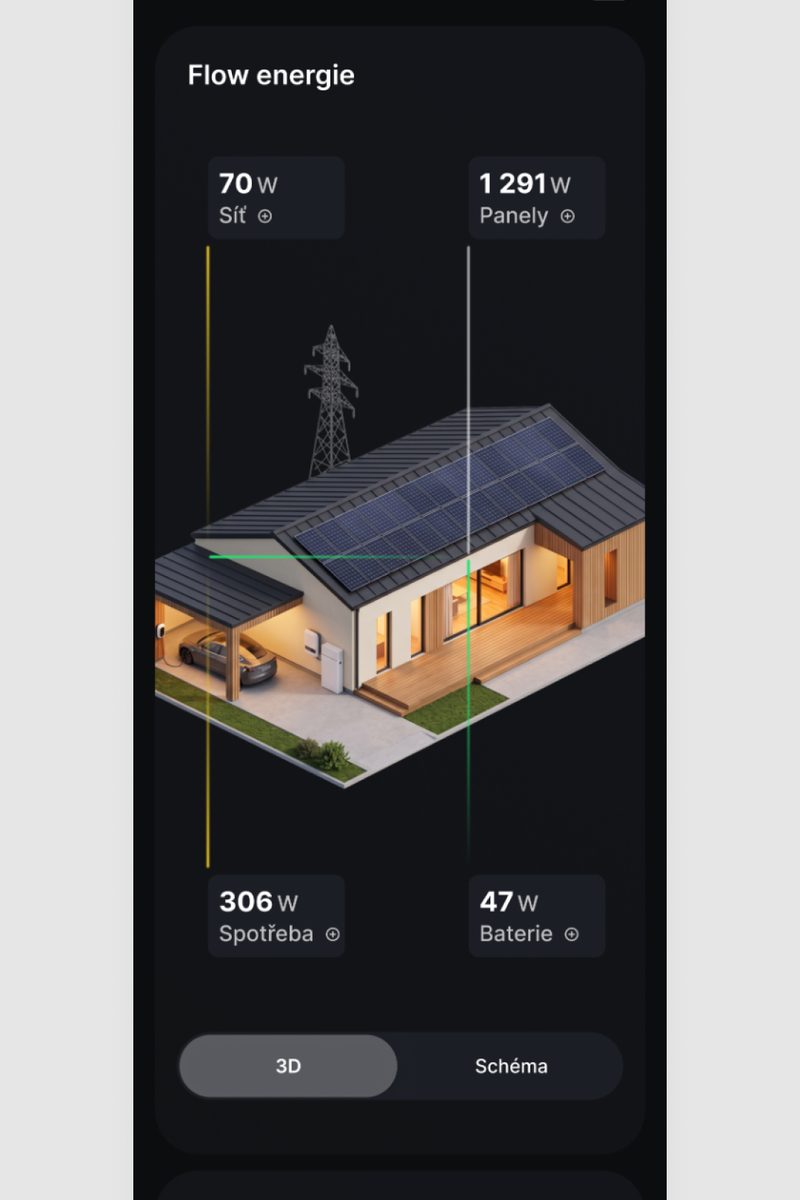
- 04Type & color system – complete design tokens ready for development, with light and dark mode from one set.
After launch, we gathered feedback from users and from the Česká solární team and worked it back into the product.
From family houses to a factory site
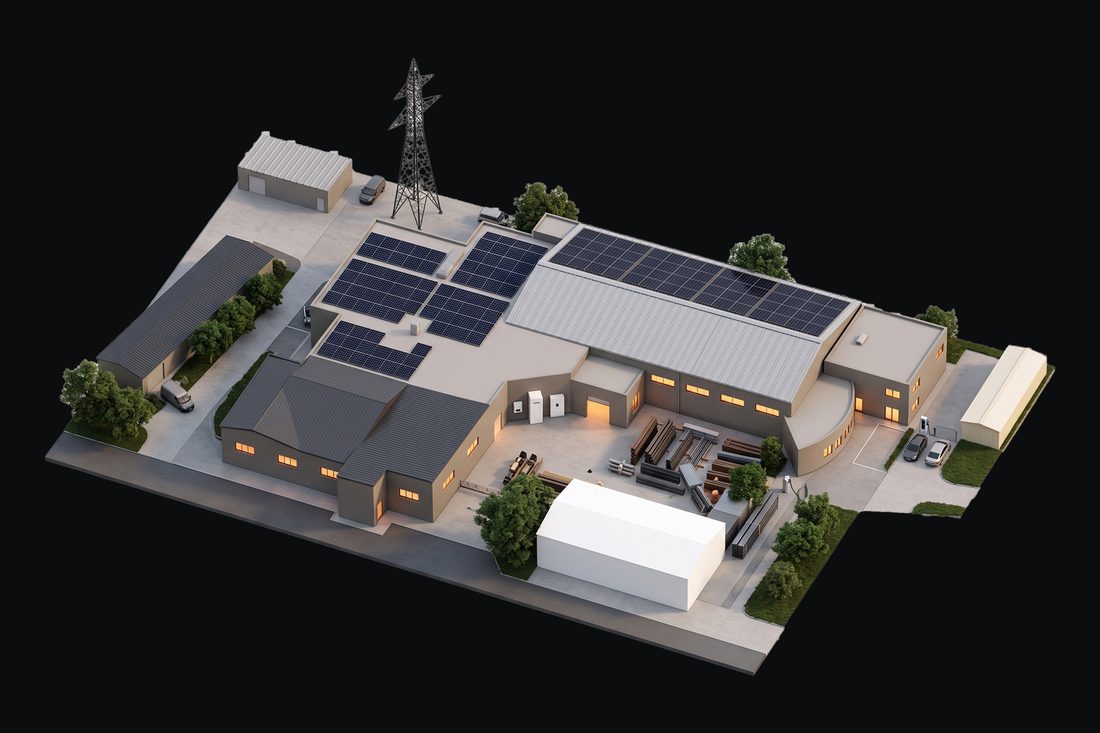
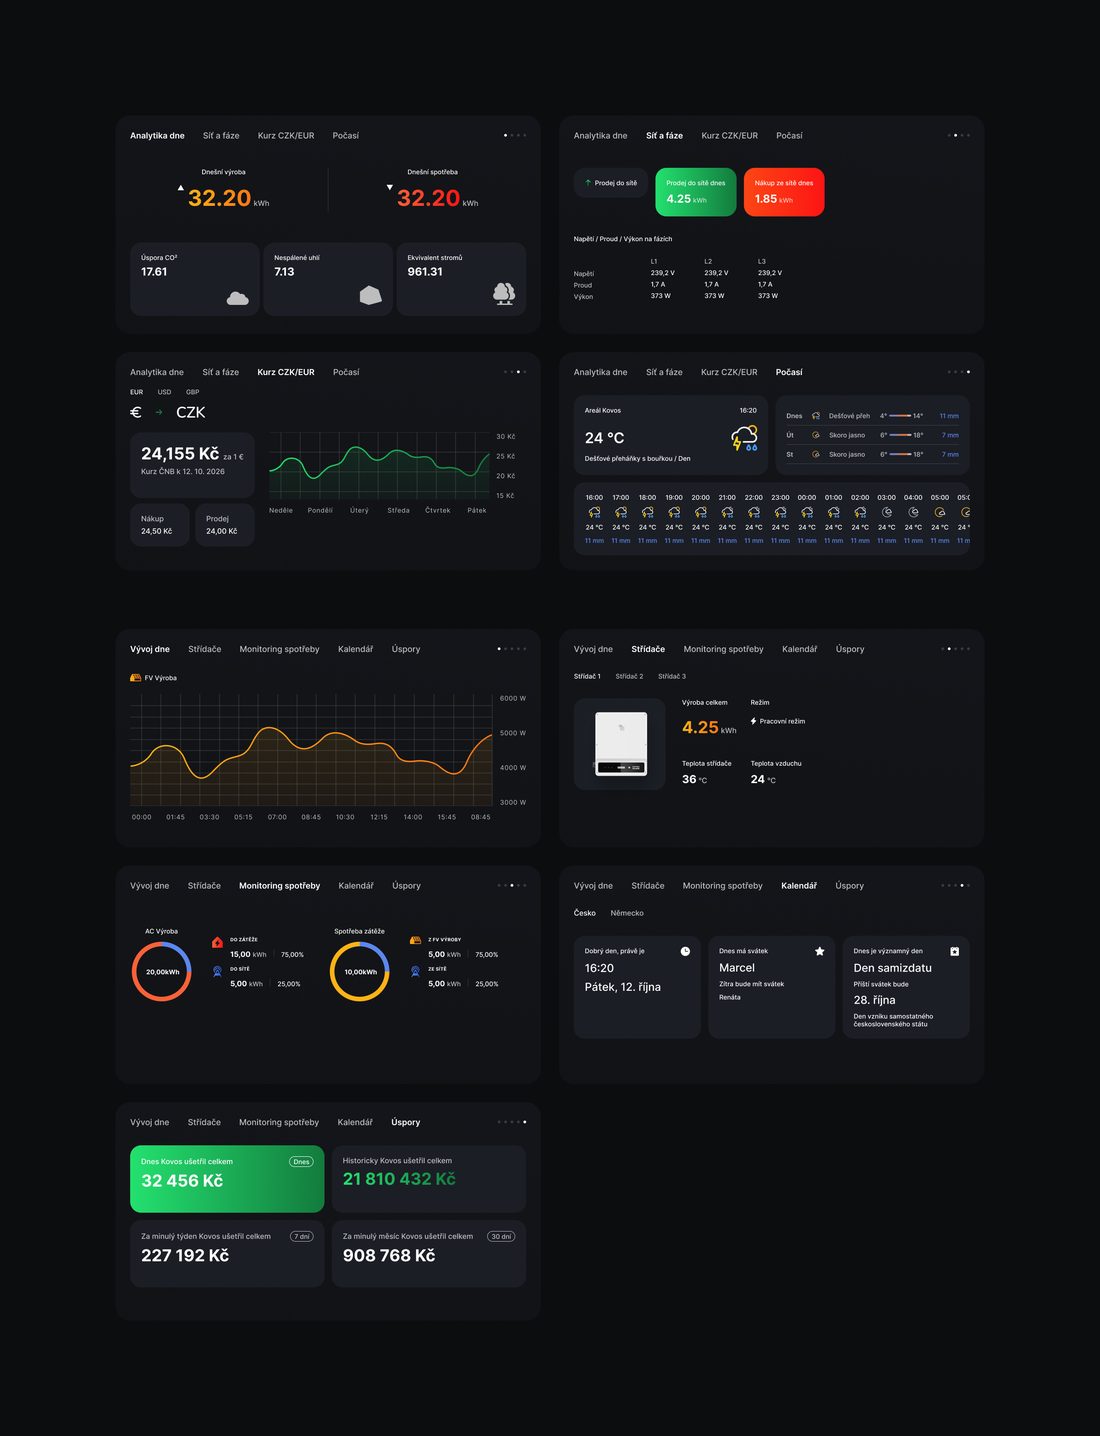
Soon after, Kovos ST, a manufacturer with solar panels on its roof, asked for a version of its own. Because the dashboard was built from modules, we added what they needed as new ones: savings, exchange rate, a calendar with public holidays, and weather. Every household sees the same 3D bungalow – for Kovos, I made a 3D visualisation of their whole site instead.
They also wanted it on a TV in their reception: an overview for the owner every morning, and something to show business partners. On the TV, energy flow with the site visualisation stays fixed on the left, while the other modules rotate every five seconds on the right.
Built to keep growing
New modules keep coming, and the same system is ready for other companies. One design system and one set of modules now serve a family home, a factory site and a reception screen.